Local History
Drakelow Power Station
The coal-fired power station that shaped Drakelow for almost half a century
Drakelow Power Station was built in three stages, known as A, B and C, on the south bank of the River Trent near Burton-on-Trent. Electricity generation began in the 1950s and ended when the C station closed in 2003.
Three generations of power station
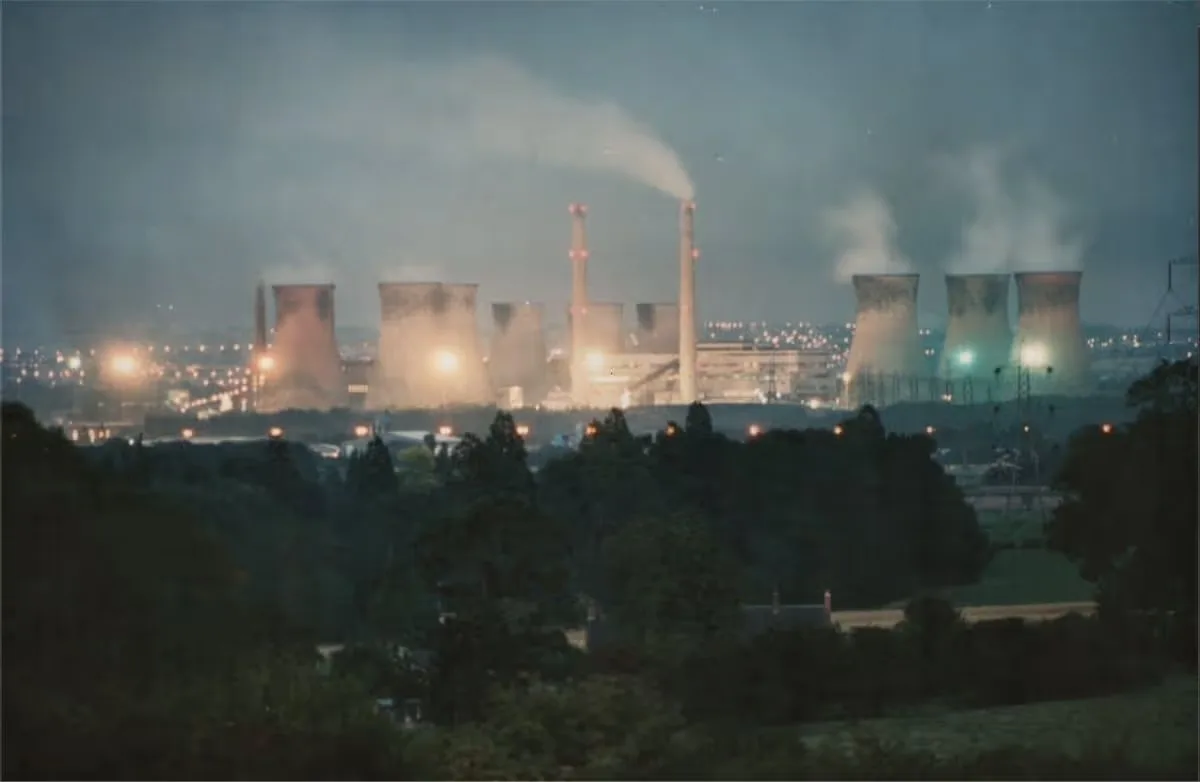
Drakelow A was commissioned in 1955, followed by the larger B station from 1959. The much larger C station began generating in 1964. Together the stations turned Drakelow into one of the most recognisable industrial landscapes around Burton.
The site expanded in stages rather than appearing all at once, leaving three distinct generations of generating plant operating beside the River Trent.
The largest and most visible phase
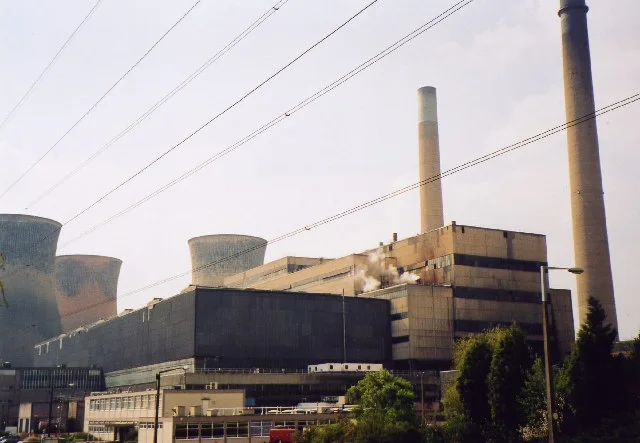
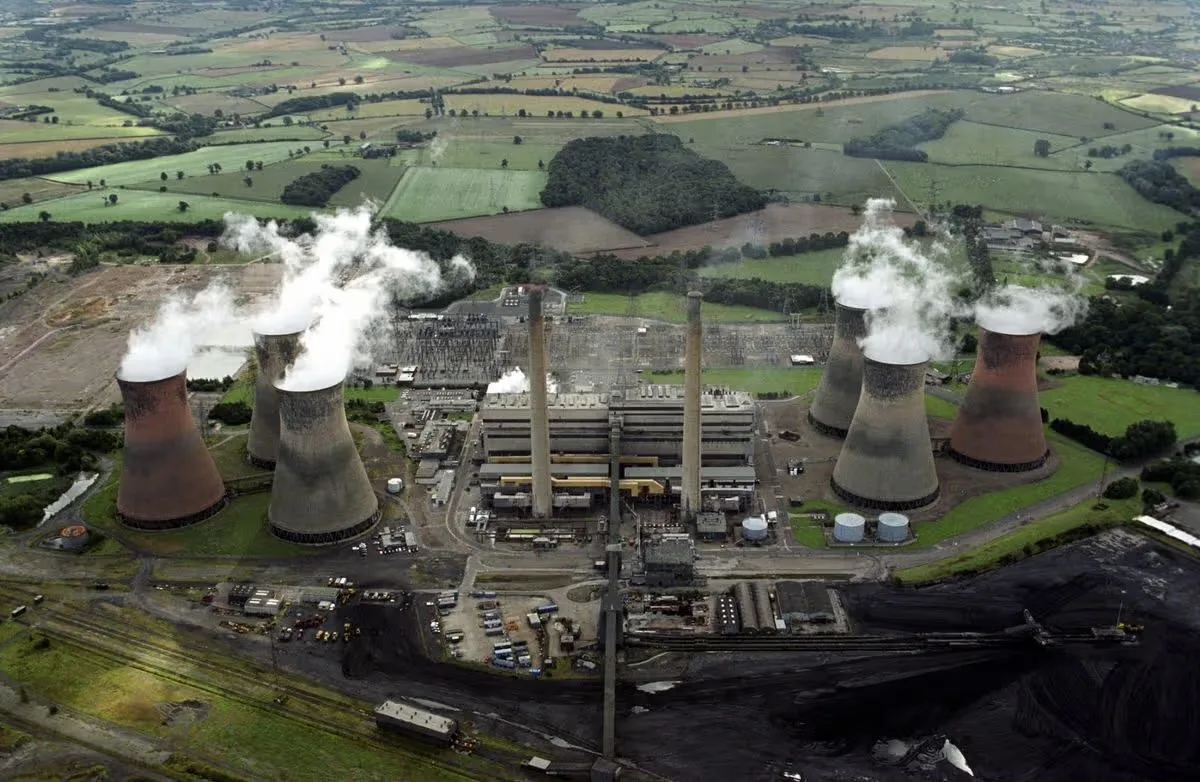
Drakelow C had six cooling towers and two tall chimneys. Its design was unusual because two cooling towers were given a warmer red colour to alter how the group appeared in the landscape, an approach later noted by Historic England in its discussion of post-war power station design.
The operational aerial view shows how tightly the generating buildings, towers, electrical infrastructure and coal-handling areas occupied the site while countryside remained immediately beyond it.
How output shifted from A to C
This comparison focuses on the five reporting periods for which published electricity-supplied figures are available for all three stations. It shows the shift from A to C more clearly than the full irregular series.
View the chart data
| Reporting period | A | B | C |
|---|---|---|---|
| 1956 | 498 | Not reported | Not reported |
| 1957 | 1,122 | Not reported | Not reported |
| 1958 | 1,451 | Not reported | Not reported |
| 1959-60 | 1,474 | 546 | Not reported |
| 1960-61 | 1,538 | 1,339 | Not reported |
| 1961-62 | 1,546 | 2,398 | Not reported |
| 1962-63 | 1,465 | 2,644 | Not reported |
| 1963-64 | Not reported | 2,344 | Not reported |
| 1964-65 | Not reported | 2,486 | Not reported |
| 1965-66 | Not reported | 2,536 | Not reported |
| 1966-67 | 1,653 | 2,710 | 1,588 |
| 1971-72 | 859 | 1,525 | 3,687 |
| 1978-79 | 754 | 1,575 | 3,121 |
| 1980-81 | 520 | 1,503.8 | 3,440 |
| 1981-82 | 218 | 1,693 | 4,035 |
Source for chart figures: published Drakelow Power Station output tables reproduced in the Drakelow Power Station article on Wikipedia. Values are presented here as published and are not interpolated.
From generating site to cleared land
Drakelow A closed.
Drakelow B closed.
The remaining A and B cooling towers were demolished.
Drakelow C was disconnected from the National Grid, ending coal-fired generation at the site.
The C station chimneys were demolished.
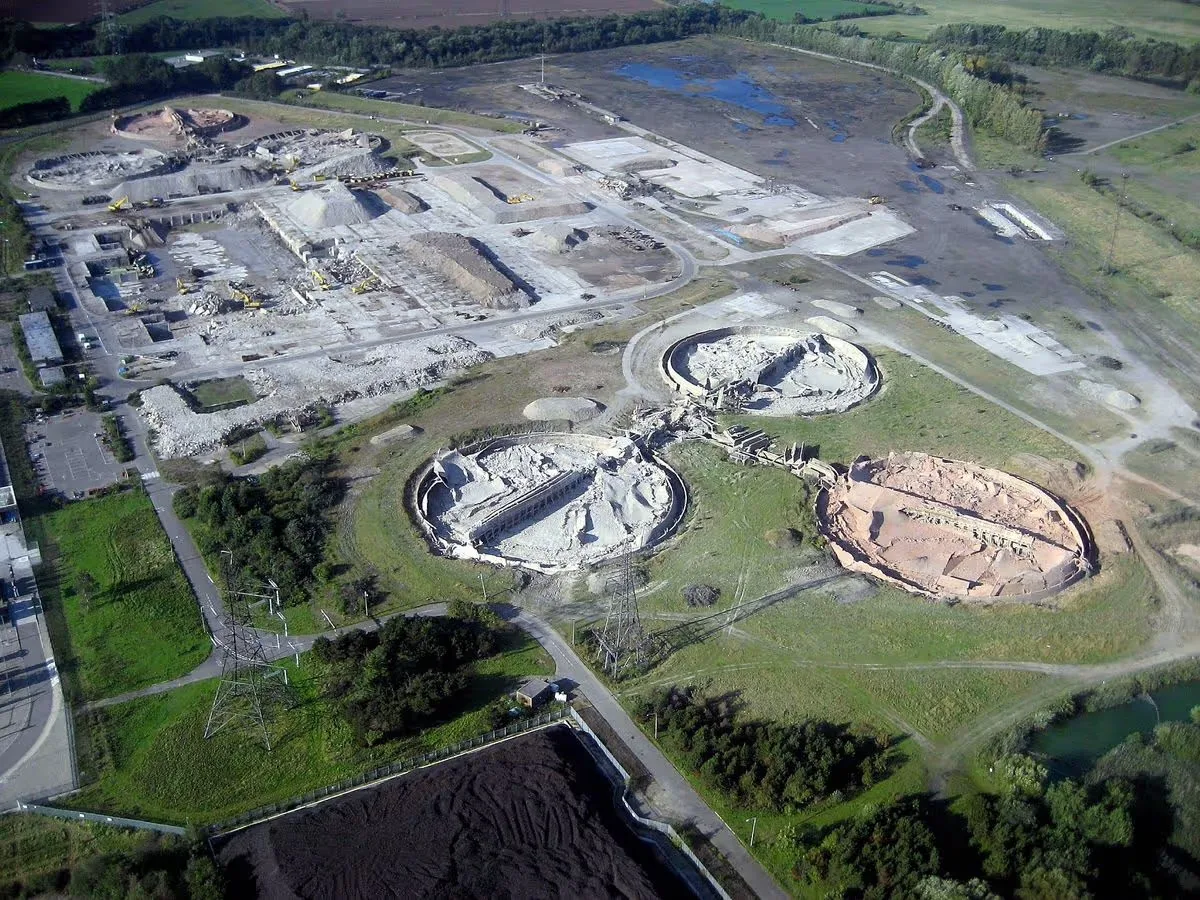
The remaining major boiler-house structures were demolished.
A much larger site with several different futures
Part of the former power-station landscape is now occupied by the Drakelow Park residential development. Separate land on the wider former station site is identified in South Derbyshire’s Local Plan review as a strategic employment allocation, with up to 68 hectares of employment use proposed. The plan also protects the existing Drakelow Nature Reserve and other ecological assets.
The wider former site is not one single development. Housing, retained nature areas, energy infrastructure and proposed employment land are separate parts of the former industrial landscape.
For current proposals, planning applications and allocation documents are more reliable than treating every project as part of the housing scheme. South Derbyshire Local Plan evidence →
Sources: South Derbyshire District Council Local Plan evidence and strategic allocation documents, Historic England material on post-war power station design, published historical records of the Drakelow stations, and the historical output tables linked above. Current planning and land-use proposals can change, so use the council planning system for live applications.